Standard Deviation and Standard Error – What is the Difference?

When studying results of scientific publications one usually comes across standard deviations (SD) and standard errors (SE). However, even both measures are widely used the difference between them is not always clear to the readers. This article aims to clarify some important points and to provide a deeper understanding of SD and SE.
When conducting a study, specific variables (e.g. age, blood pressure) in a sample are collected. This sample has been taken from a larger population of interest, the so-called total population. Such a total population might comprise for example all patients with a specific indication. Ideally, the sample taken within the study represents the total population, i.e. it is similar to the total population with respect to collected data.
The SD gives the variability of a variable within the study sample providing an estimate of the actual variability in the total population. For example, a total population with a heterogeneous age distribution should also lead to a high SD of age in the study sample. It is calculated as the average of the (quadratic) differences from the sample (arithmetic) mean \overline{x}:
\large SD=\sqrt{\frac{\sum^n_{i=1}{(x_i-\overline{x})^2}}{n-1}}
For interpretations, it is important to know: \overline{x}\pm SD overs about 68% and \overline{x}\pm 2\cdot SD about 95% of all observations in the sample regardless of the distribution. Moreover, the SD is strongly influenced by single outliers. That means, few extreme high or low values can increase SD remarkably.
The SE on the other side depends on the measurement accuracy of the variable and gives the precision of the sample mean with respect to the mean in the total population. To understand this it is important to remember that the sample mean itself is only an estimation with a specific uncertainty: different study samples will yield to different sample means. In other words, the SE gives the precision of the sample mean.
However, there is a direct connection between SE and SD:
\large SE=SD/\sqrt{n}
Hence, the SE is always smaller than the SD and gets smaller with increasing sample size. This makes sense as one can consider a greater specificity of the true population mean with increasing sample size. In contrast, the SD, which estimates the variability in the total population is independent from the sample size, i.e. it remains similar when increasing the sample size.
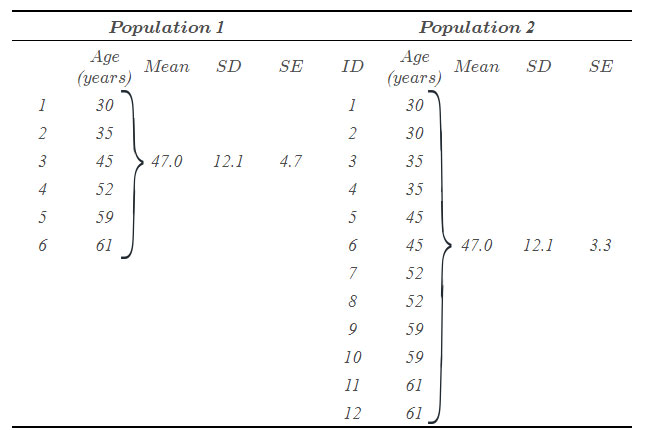
An example of SD and SE of age for two fictive populations is given in the table. The first population comprises six patients. The second population comprises twice population 1. Thus, the mean and SD are identical in both populations. However, as the SE depends on the number of patients the SE of population 2 is smaller than of population 1.
Table: Example for SD and SE of age in two populations.

Possibly because the SE is always smaller than the SD, many authors tend to show SE in order to describe the variability of a variable. However, this is not correct. Actually, the SE should only be used for hypothesis testing (e.g. “Is the actual mean different from a specific constant value?” or “Are means of two groups different?”) and to calculate confidence intervals (CI):
\large 95\%-CI=\overline{x}\pm 1.96\cdot SE
In summary, when describing the variability of measurements in a sample, the SD is the parameter of choice. The SE describes the uncertainty of the sample mean and it should only be used for inferential statistics (hypothesis testing and confidence intervals).
References
Altman D. and Bland M.: Standard deviations and standard errors. BMJ 2005; 331
Koschack J.: Standardabweichung und Standardfehler: der kleine, aber feine Unterschied. Z Allg Med 2008; 84
Nagele P.: Misuse of standard error of the mean (SEM) when reporting variability of a sample. A critical evaluation of four anaesthesia journals. Br J Anaesth. 2003 Apr; 90 (4)
Picture: © ISTANBUL2009


